Where in South Korea does surplus solar make Bitcoin mining nationally profitable?
A two-stage hierarchical spatial framework. Stage one ranks 250 administrative districts by a composite of surplus power and land price; stage two simulates revenue and net profit on real Bitcoin market data to identify the optimal machine count per region.
Korea's surplus solar electricity nearly doubled in five years.
South Korea has been expanding solar PV capacity rapidly, driven by national renewable-energy policy and household-level adoption. To accommodate this, Korea Electric Power Corporation (KEPCO) operates a solar offset trading system that lets producers feed surplus generation back to the grid.
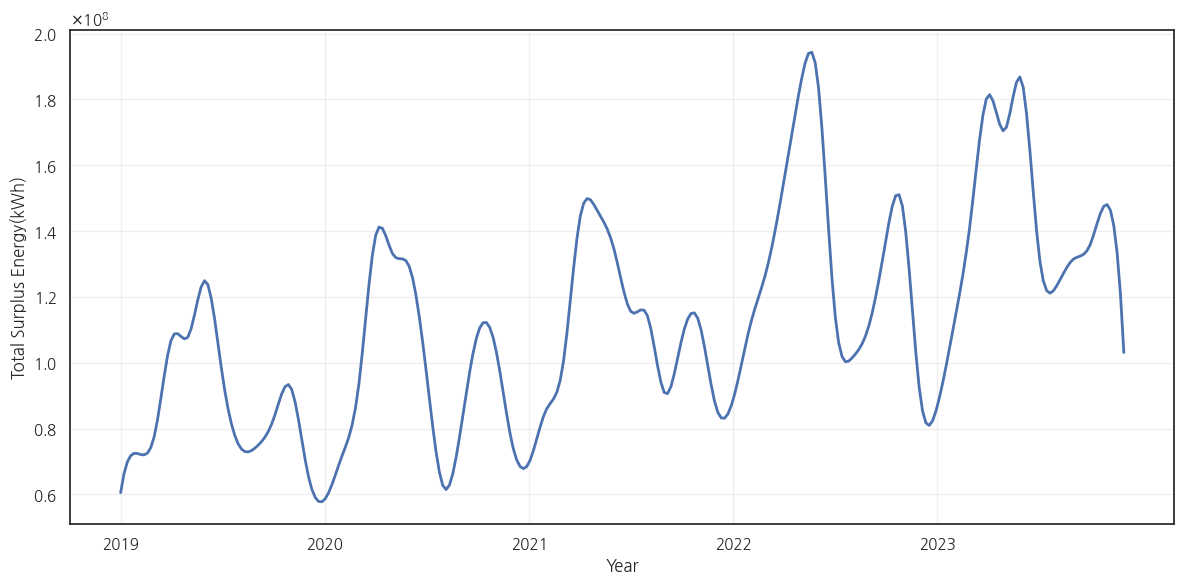
Even so, a meaningful share of generated electricity still goes unused. National surplus solar electricity grew from 1.04 billion kWh in 2019 to 1.65 billion kWh in 2023, an increase of 59.3% in just four years. That surplus is both a missed opportunity and a grid-management headache: it represents capacity that exists, was paid for, and is not returning value to the system.
Bitcoin mining is location-flexible and energy-intensive. Channelling otherwise-wasted solar electricity into mining could turn a stranded asset into measurable economic and environmental returns. The open question is a spatial one: where in Korea does surplus availability, land cost, and grid topology actually make the proposition profitable?
250 administrative districts, five years, three open datasets.
I assembled monthly panel data on 250 administrative districts from 2019 through 2023, joining three sources:
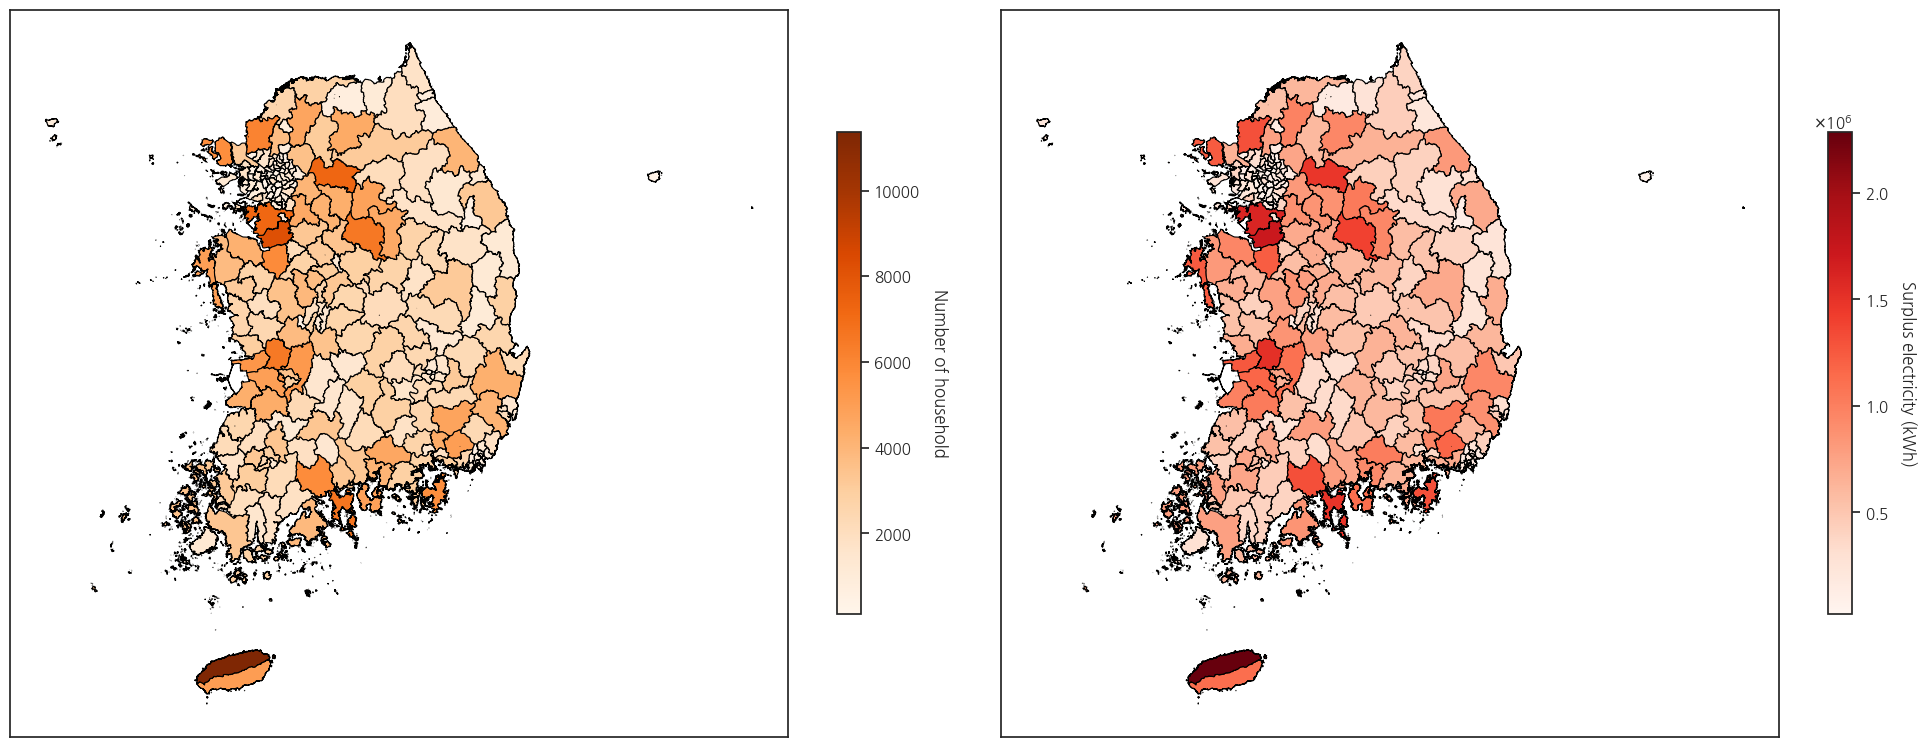
- KEPCO surplus electricity (Public Data Portal), monthly surplus solar generation per district, plus number of households with installations.
- Government Assessed Land Value: five-year average per district, used as a proxy for population density (which correlates with land price but is harder to source consistently).
- Bitcoin market data: daily price (USD) and network hash rate, 2019–2023, including the May 2020 halving event.
Aggregated across all districts, the five-year mean surplus is 447,021 kWh per district, with substantial spread (std 323,949; max around 2 million kWh). Both the household count and surplus volume show a clear upward trend over the period.
Two stages: rank, then simulate.
I split the question into a ranking stage and a profitability stage. The ranking stage uses a single composite score; the profitability stage runs a fixed-investment optimisation against real Bitcoin market data.
Stage 1 · Composite site-evaluation score
For each district i, I min-max normalise surplus power Pi and land price Li, then combine them through an exponential decay:
The exponential form lets surplus power dominate when land is cheap, but sharply penalises high-priced regions. The parameter λ controls how aggressive that penalty is. I started with λ = 3 and ran a sensitivity analysis over the range λ ∈ [1, 5] to test robustness.
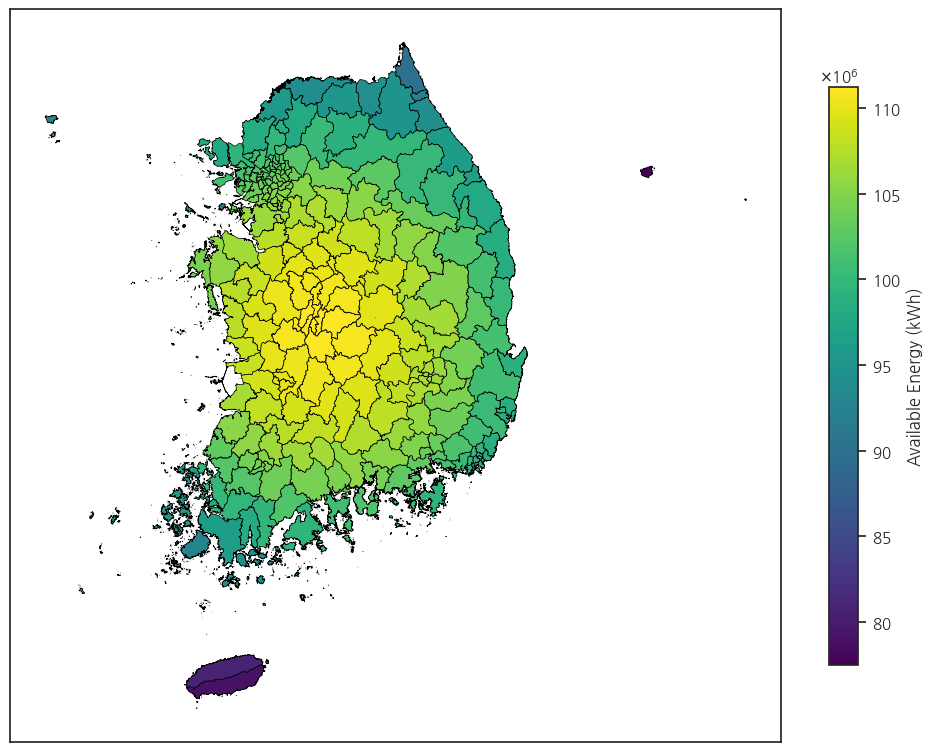
Transmission losses matter because power has to travel from the surplus region to the mining facility. I built a pairwise distance matrix in UTM-K (GRS80) coordinates between district centroids, scaled by 1.2 to approximate actual line length, and applied a loss rate of 0.0978% per kilometre (consistent with 154 kV transmission). The resulting efficiency matrix adjusts each region's effective available power.
Stage 2 · Profitability simulation
For the top-ranking regions I simulated annual mining profitability against a specific hardware target: the Bitmain S21 XP+ Hyd. (500 TH/s, 5,500 W, 11 J/T efficiency, $15,350 unit cost, 90-month straight-line depreciation).
The simulation searches over candidate machine counts N and picks the configuration that maximises annual net profit, subject to a monthly capacity ceiling derived from each region's usable power (with an 80% safety margin):
Monthly revenue is computed against the live Bitcoin economy:
The custom reward function handles the May 2020 halving (12.5 → 6.25 BTC), and 4,320 reflects 144 blocks per day across a 30-day month. Net profit deducts annual depreciation. The output for each region is a clean tuple: optimal machine count, annual revenue, depreciation, net profit, and average utilisation rate.
Three districts, all in Chungcheongbuk-do, robust across λ.
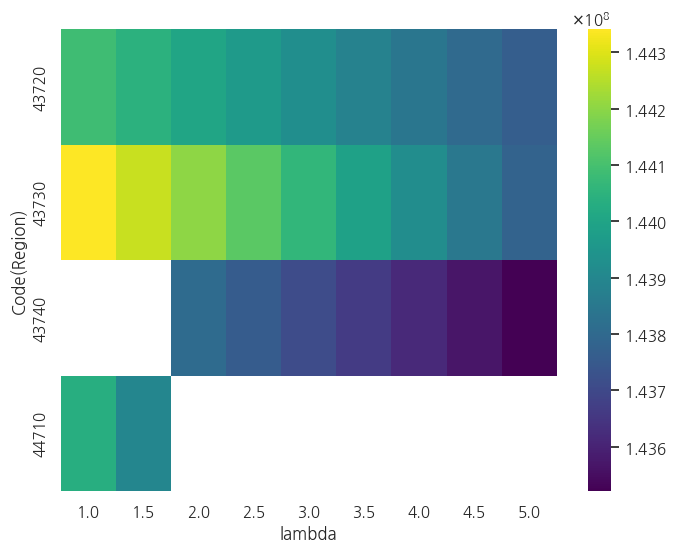
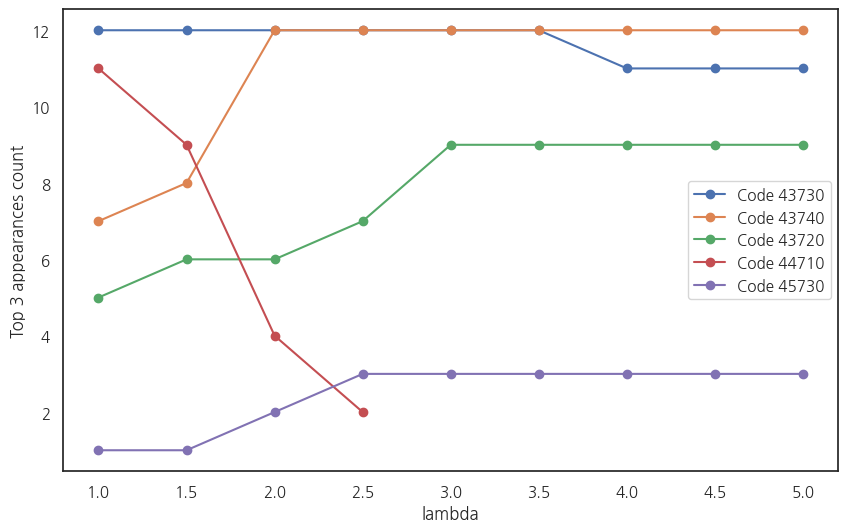
Across the full sensitivity range λ ∈ [1, 5], three districts persistently appear in the top-3 list:
- 43730, Okcheon-gun, Chungcheongbuk-do
- 43740, Yeongdong-gun, Chungcheongbuk-do
- 43720, Boeun-gun, Chungcheongbuk-do
All three are in the same central province. That clustering matches the availability map from Stage 1: central Korea benefits from shorter aggregate transmission distances, and Chungcheongbuk-do specifically has moderate land prices, low population density, and decent surplus generation.
Final profitability per region
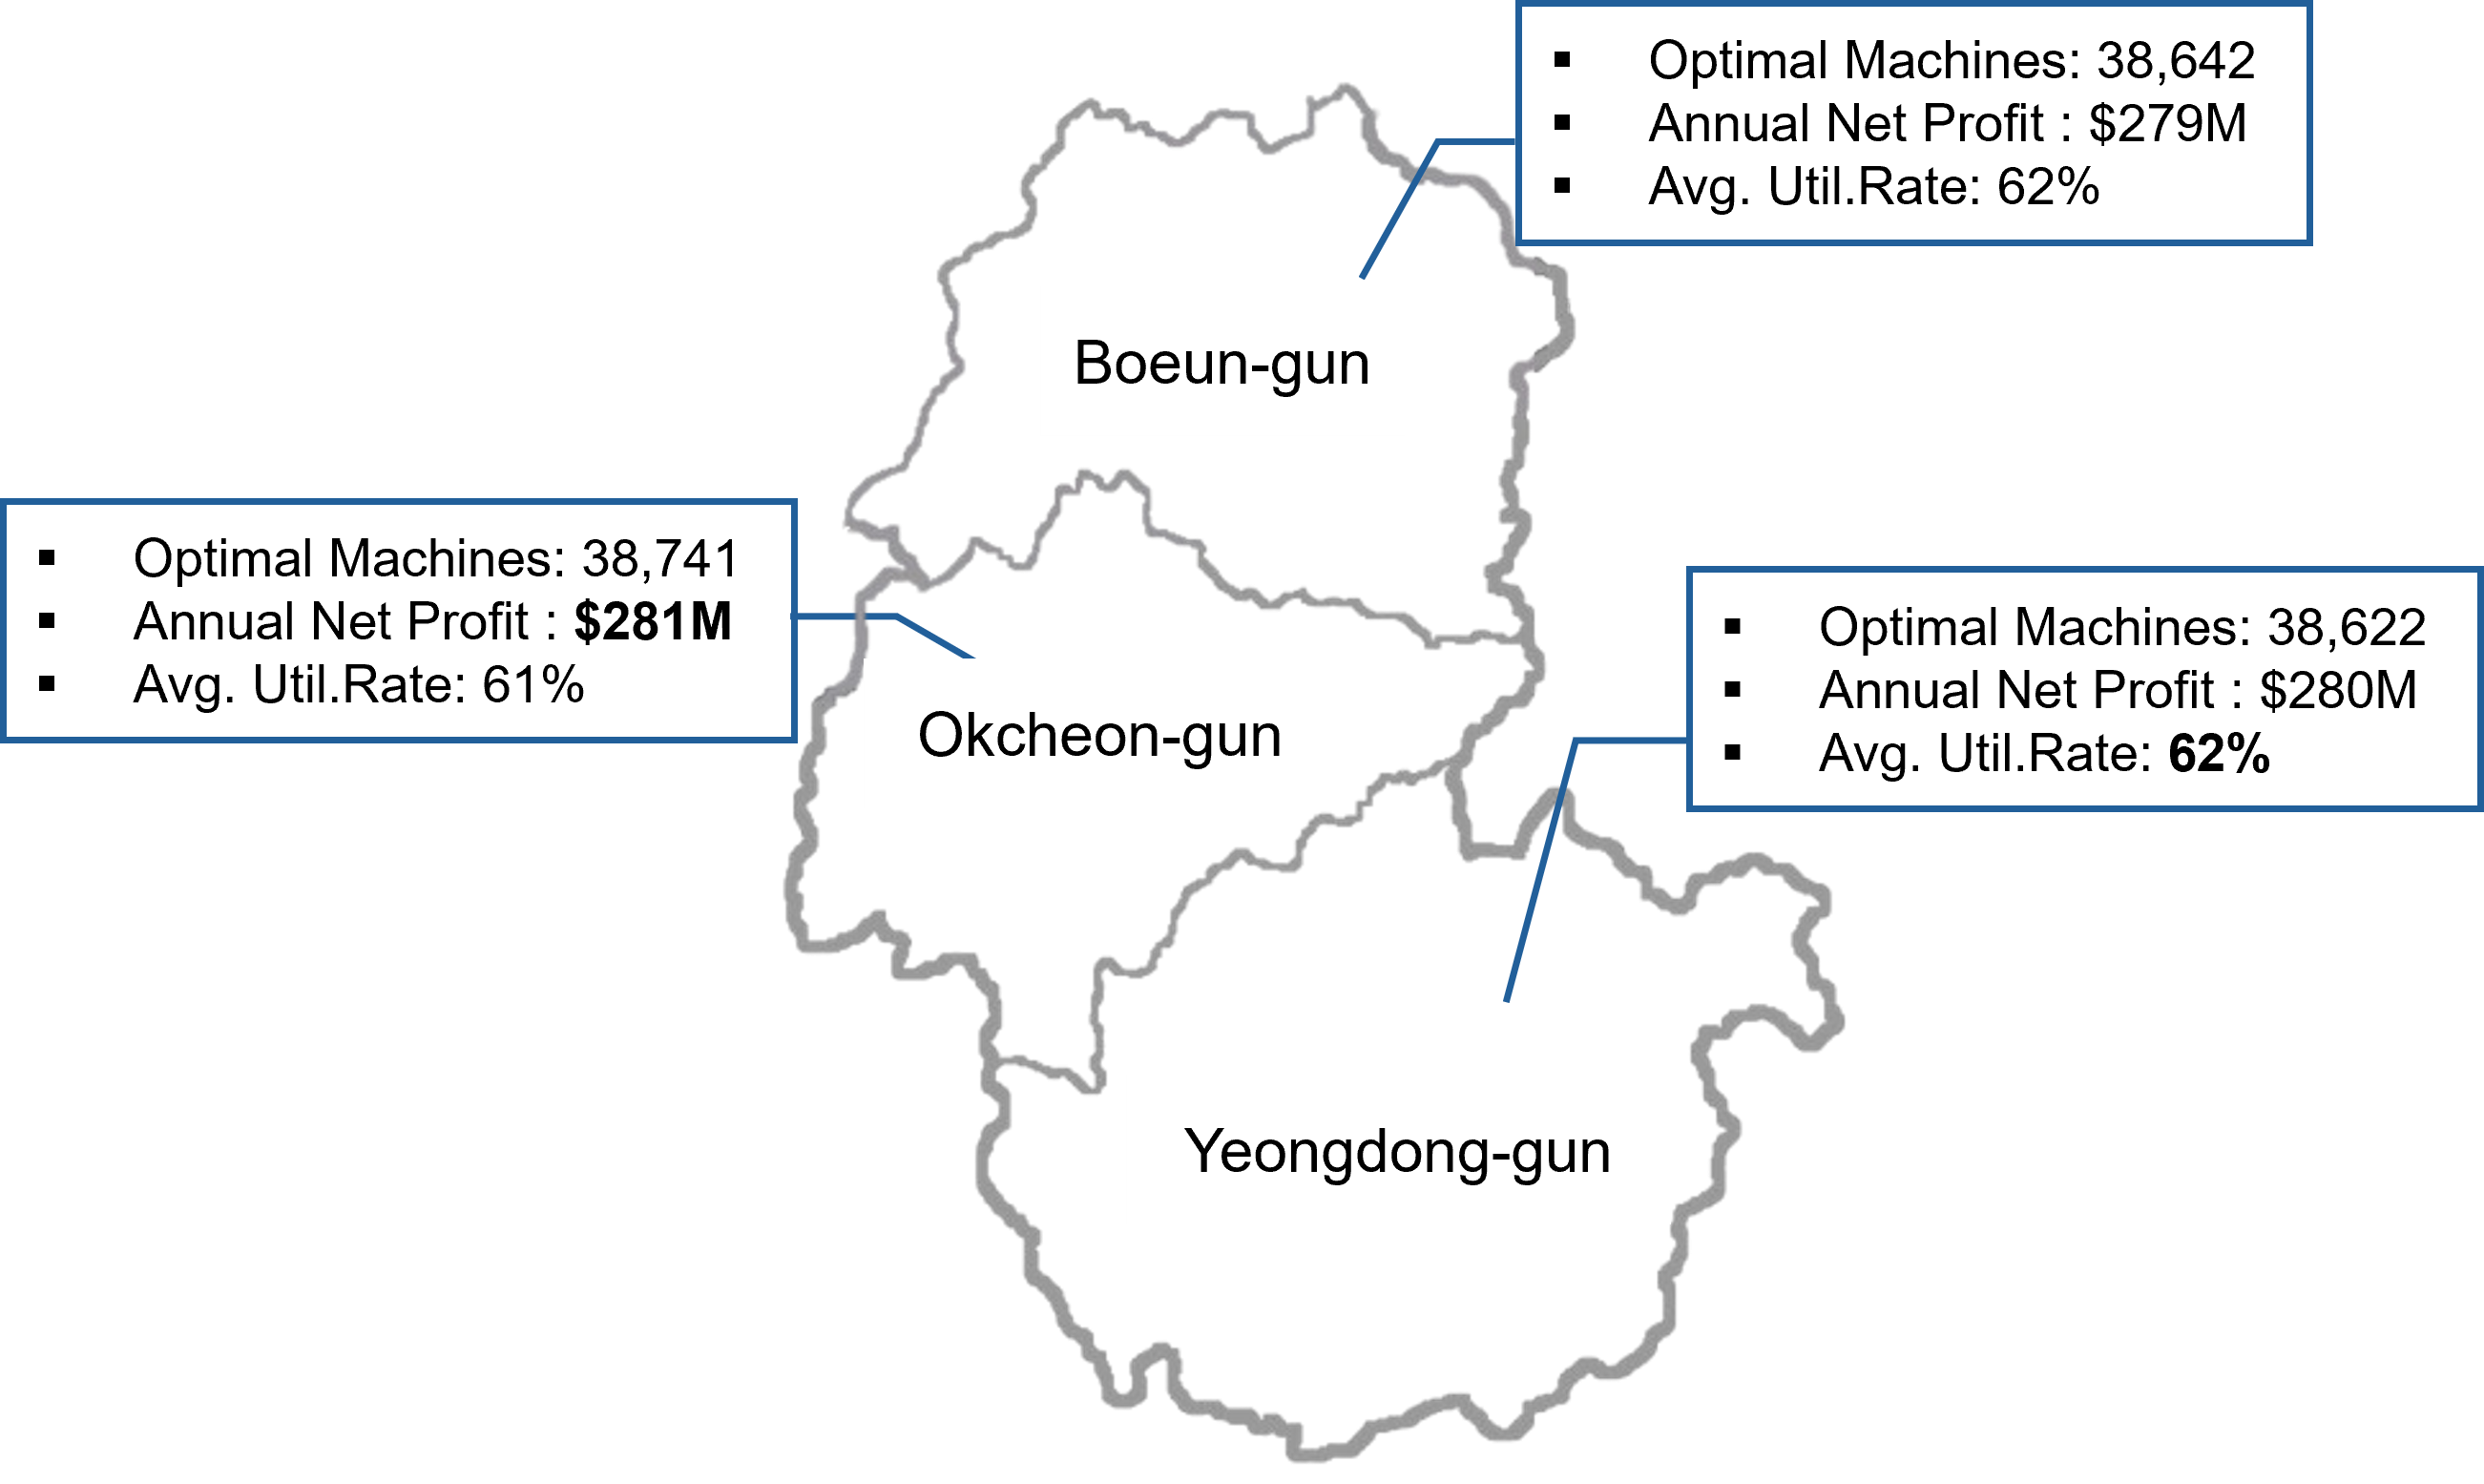
For each candidate region, the optimisation converges to roughly the same operating point: about 38,600–38,750 mining machines, ~62% average utilisation, and ~$280M in annual net profit: with combined potential of approximately $307M per year.
The three top regions emerge from the same province under every tested λ once the model is free of edge cases. Site selection is robust to the policy weighting on land price, which means the recommendation can survive most reasonable adjustments to the cost framework.
A strategic blueprint for surplus-energy monetisation.
The framework demonstrates that surplus solar can underwrite a meaningful share of national crypto-mining capacity without any new generation. Three practical implications follow:
- Provincial-scale coordination is feasible. All three optimal districts sit in Chungcheongbuk-do, which simplifies regulatory, grid-operator, and stakeholder alignment to a single provincial authority.
- The recommendation is policy-stable. Sensitivity over λ shows the same regions surfacing under both surplus-led and land-price-led weightings. A new administration could re-tune the policy preference and still land on the same top sites.
- The methodology generalises. Any cost-benefit site-selection problem with two normalised criteria can use the same exponential-penalty score plus distance-loss adjustment plus simulation pattern. Solar and Bitcoin happen to be the case study.
The work is published as arXiv 2511.21773 with an earlier version at arXiv 2505.00303, and was presented at the WSS 2025 Workshop on Spatial Statistics.